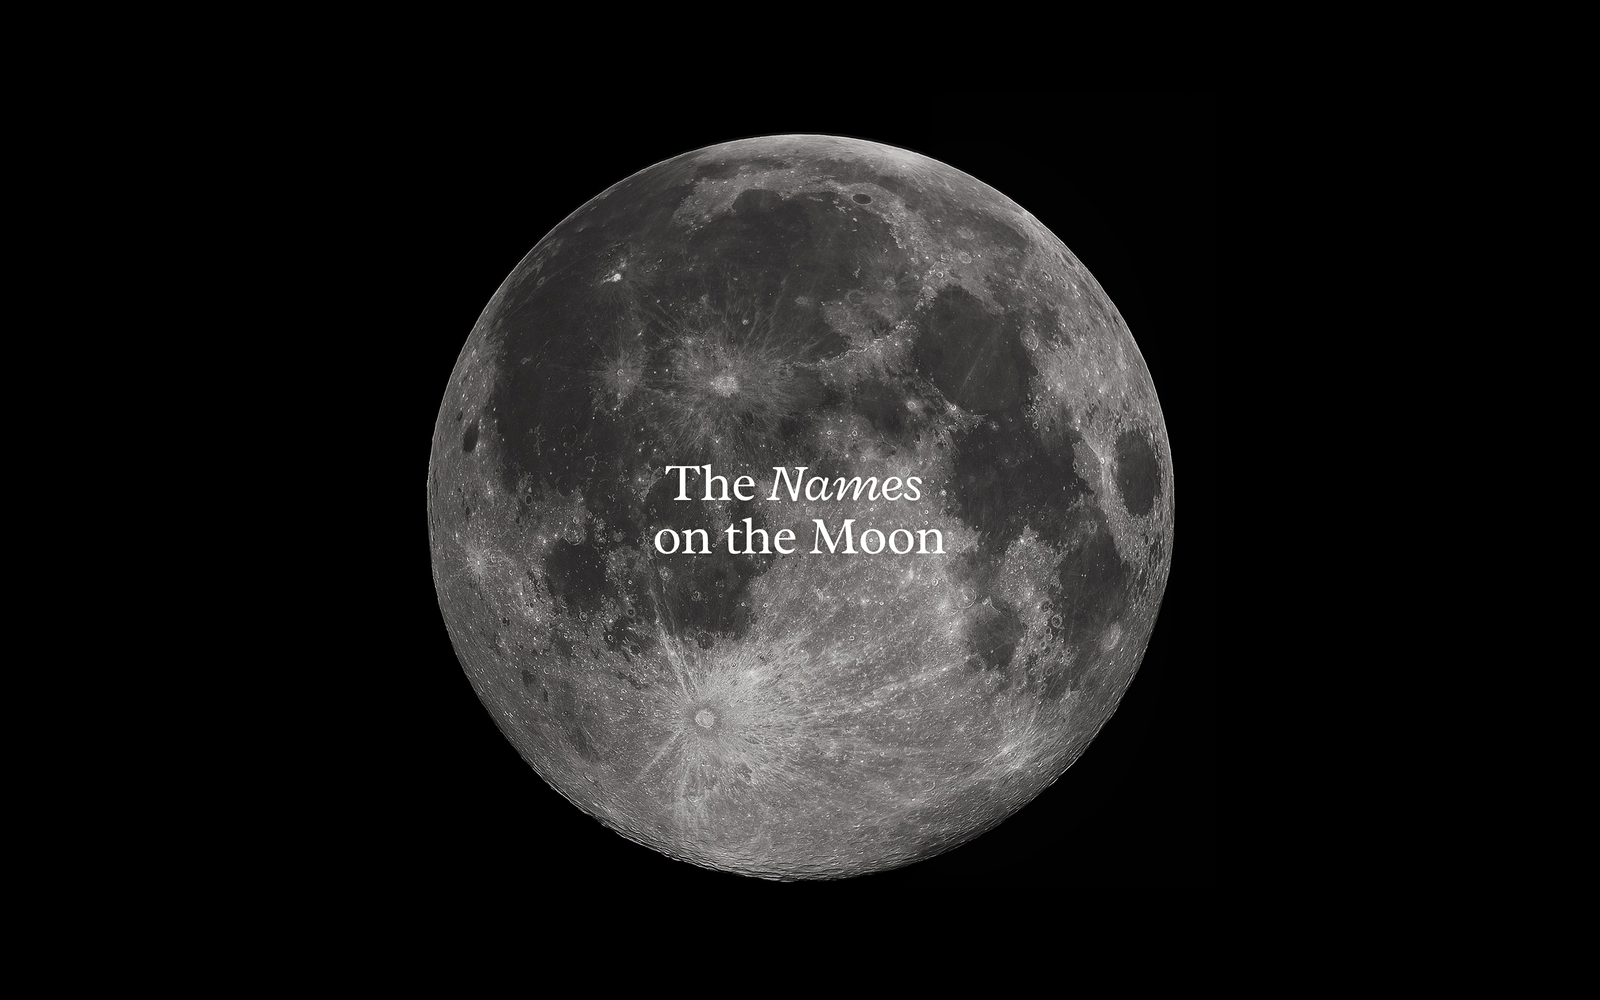
How do we visualize the Moon’s surface beyond what we see in photos? Despite centuries of observation, many subtle features remain elusive to the naked eye.
This project offers a new lens: a detailed visualization of the Moon’s surface topography.
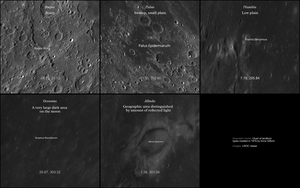
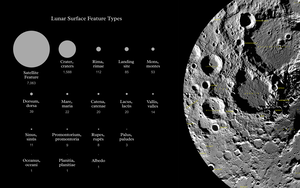
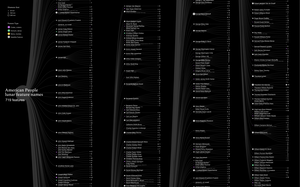
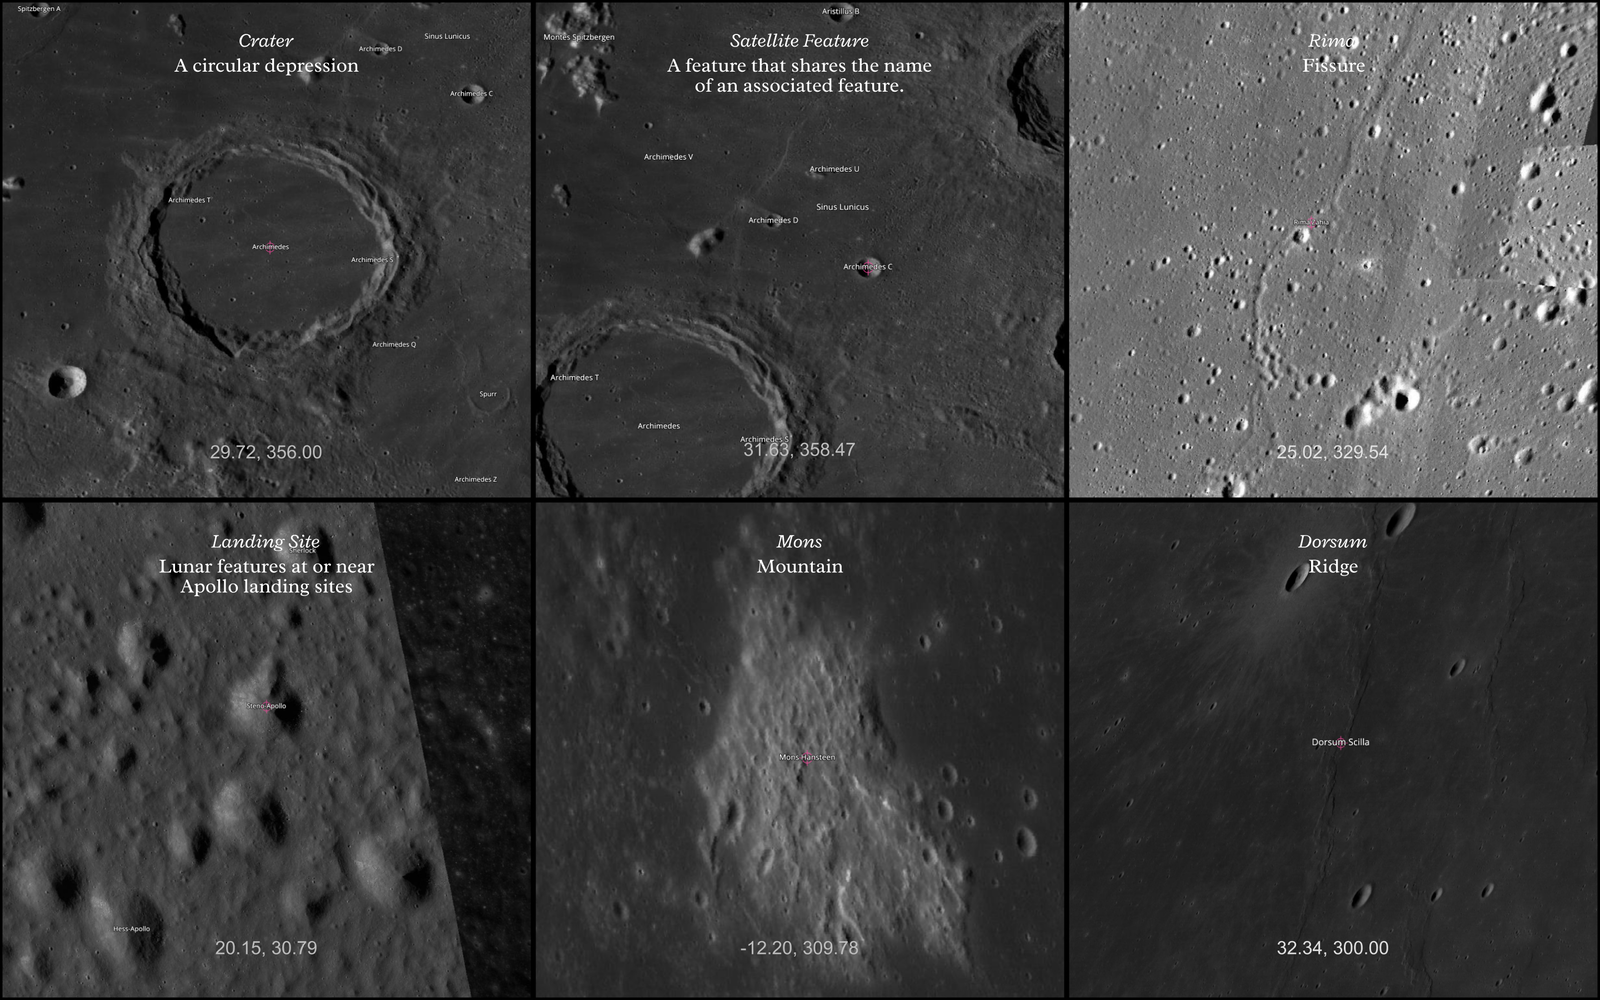
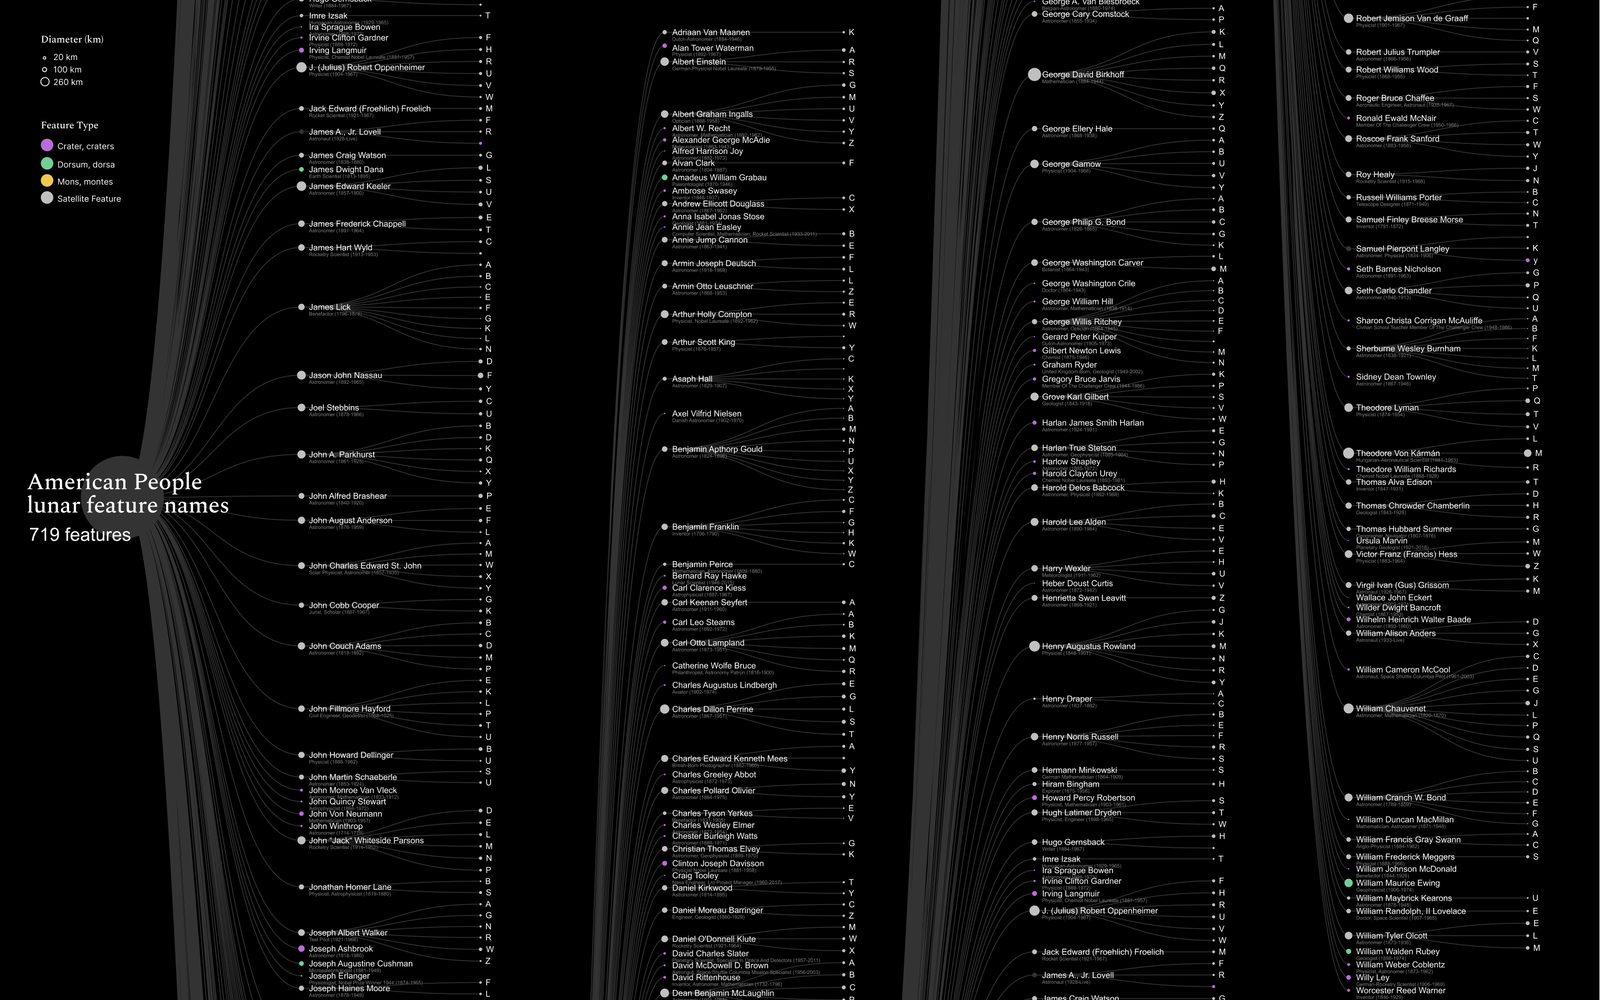
This project transforms lunar surface features into a detailed visualization, categorizing them by the names assigned to craters, mountains, and other formations. Each feature is mapped and represented visually, revealing patterns in how we have named and documented our closest celestial neighbor.
The underlying data comes from publicly available sources provided by the International Astronomical Union (IAU) and the United States Geological Survey (USGS), including satellite imagery, elevation data, and feature catalogs that are freely accessible to everyone.
Using QGIS, Cinzia mapped the lunar features onto raster images of the Moon, creating detailed visualizations that highlight the distribution and categorization of named sites across the lunar surface.
This project is more than a map — it's a journey across lunar landscapes, helping us understand the Moon's terrain and fostering appreciation for celestial exploration.