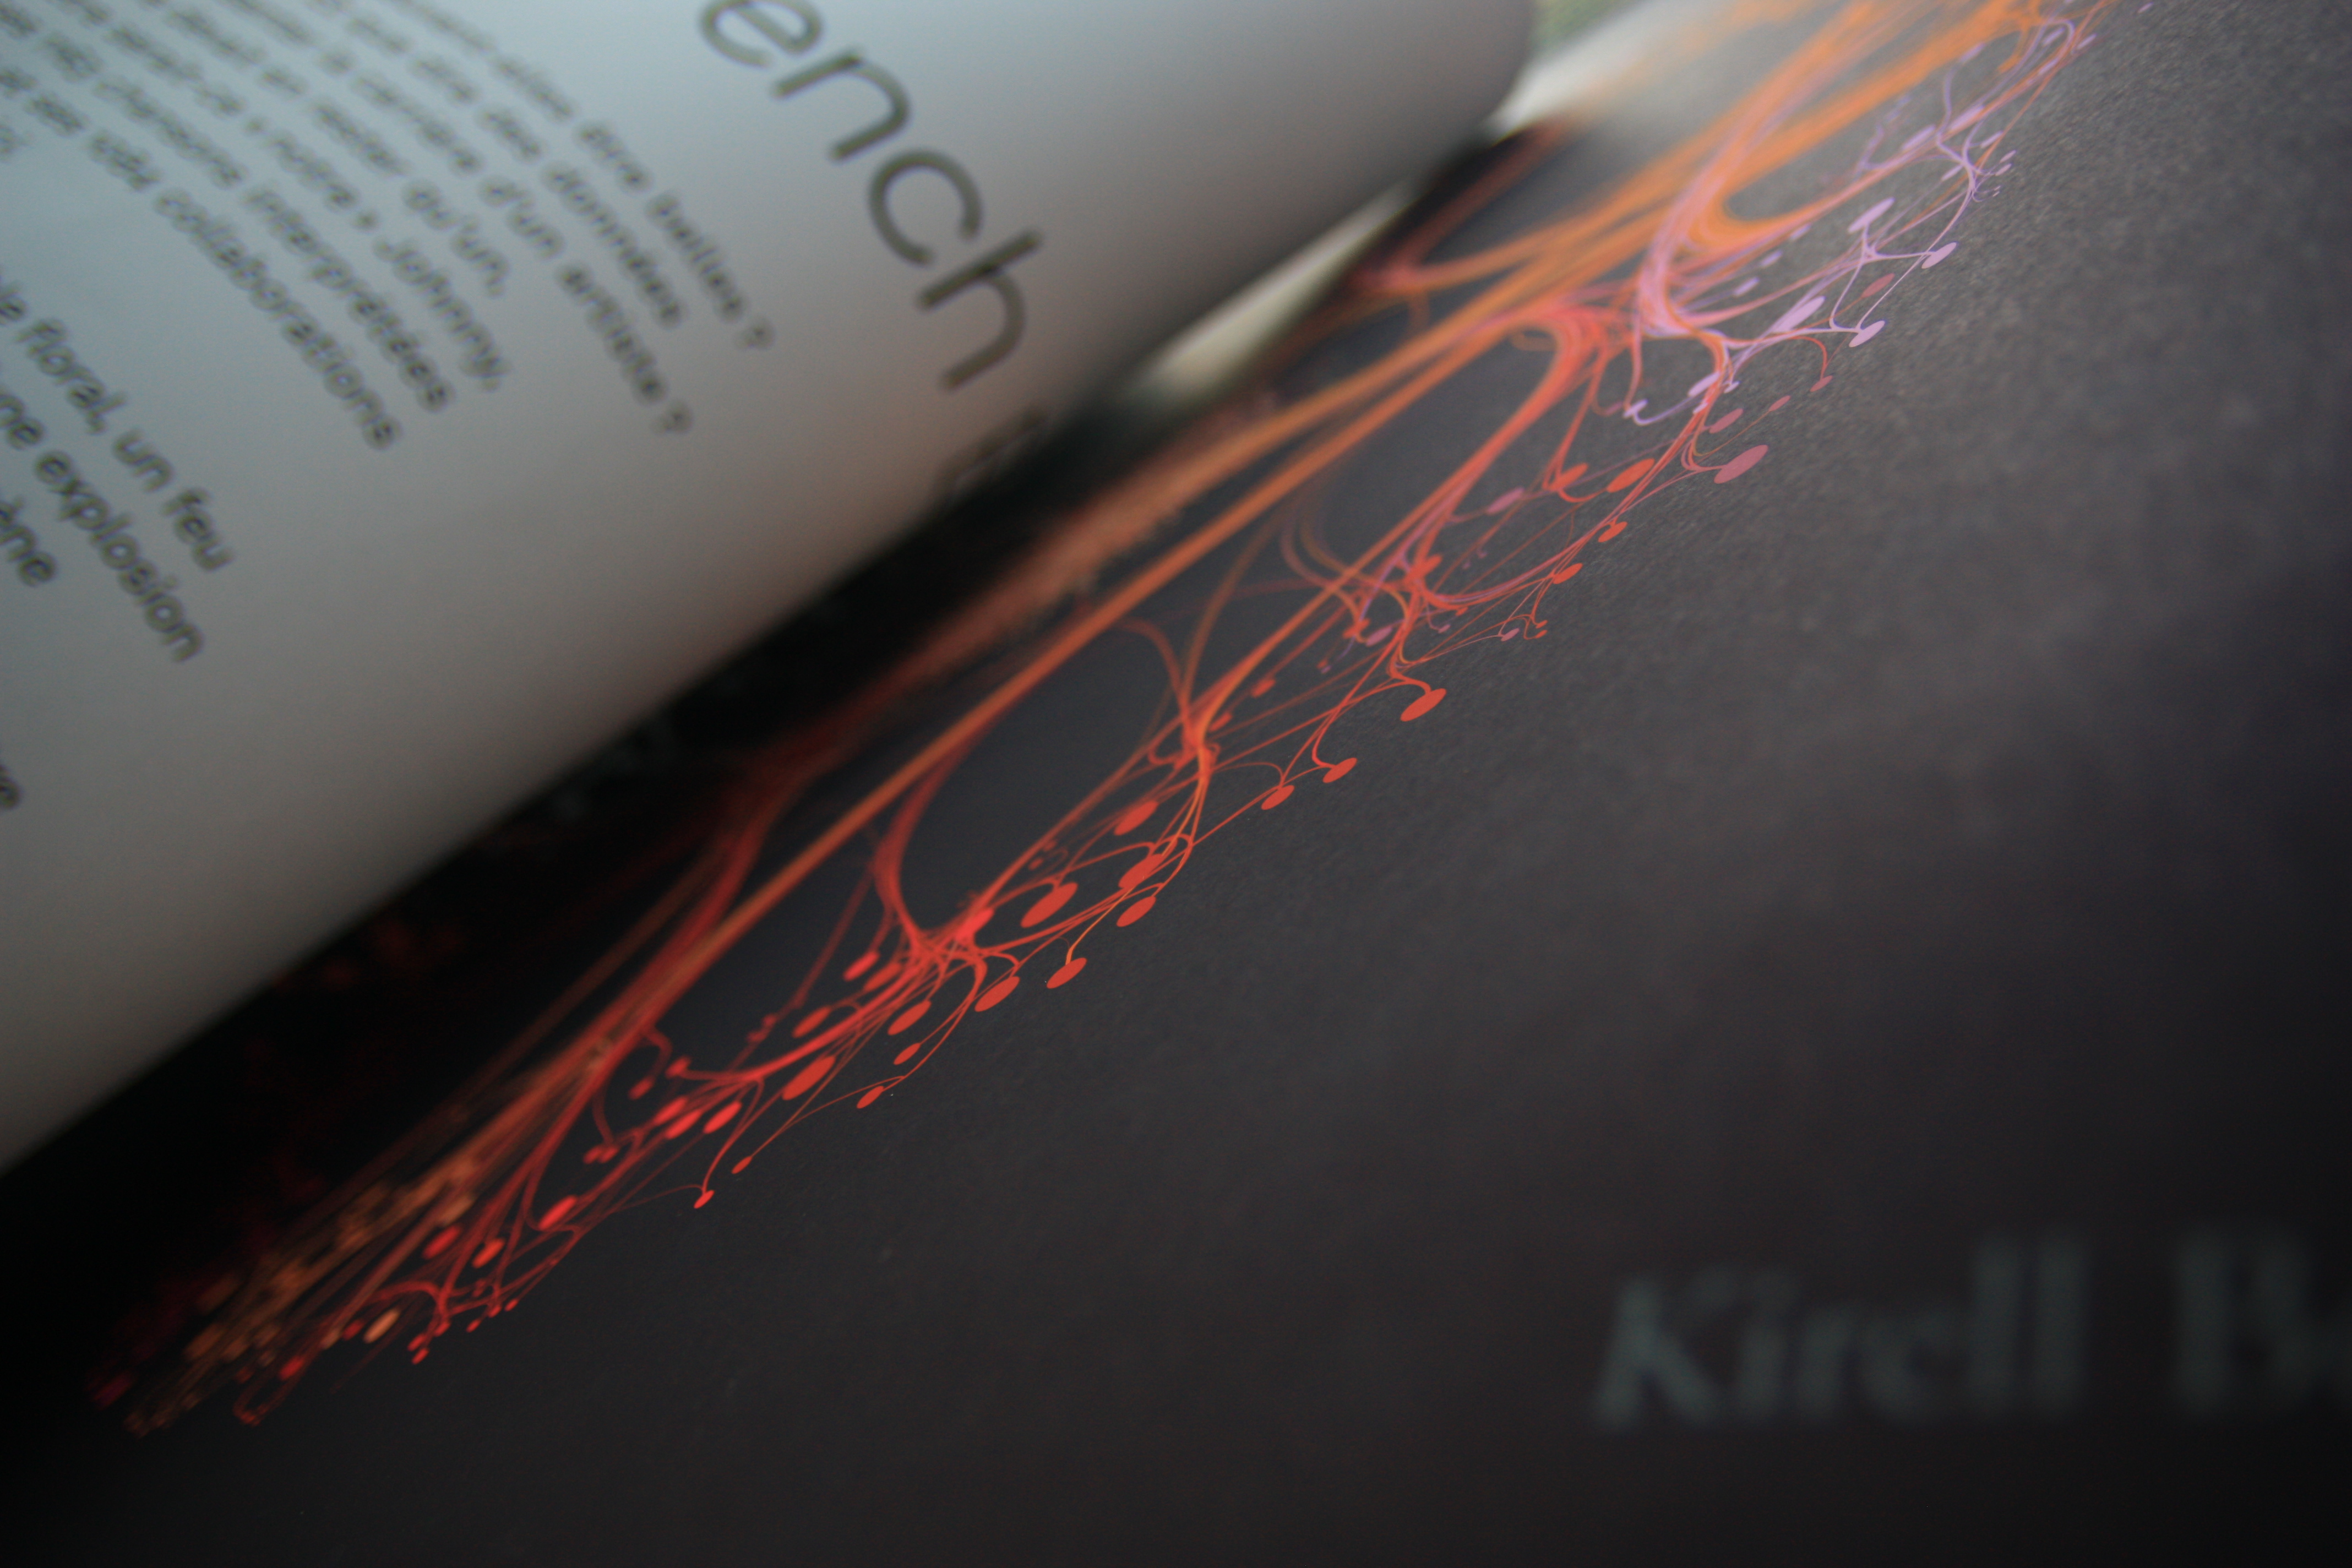
Work by Kirell Benzi at the Nantes Digital Week. Soon included in Data To Art.
Data To Art began as a meeting between a curator and a dataviz passionate. Both fascinated by the emotional side of data.
Work by Kirell Benzi at the Nantes Digital Week. Soon included in Data To Art.
We've long been fascinated by the many ways information can be represented. Some artists use data as a medium to create truly beautiful works.
But these masterpieces are scattered across the internet, with no central place to discover or showcase them. That's why we created Data To Art.
Marthe has curated Data Art for years and knows its community and languages inside out. Yan is a software engineer passionate about dataviz. Bringing our skills together to build this project was a natural step.
We carefully select the best data artists and present their work in a thoughtful, beautiful way.
Data To Art is free, hybrid, and inclusive. It celebrates diverse approaches and styles, offering a space for creators to experiment and innovate. We invite you to experience data differently — to see its beauty, and to discover how it can move, inspire, and spark reflection.

Yan Holtz is a data visualization expert and software engineer with 10 years of experience helping researchers and companies craft their charts.
He’s also the creator of popular sites like Data-to-Viz and the Graph Galleries, so chances are, you’ve already benefited from his work without even knowing it!
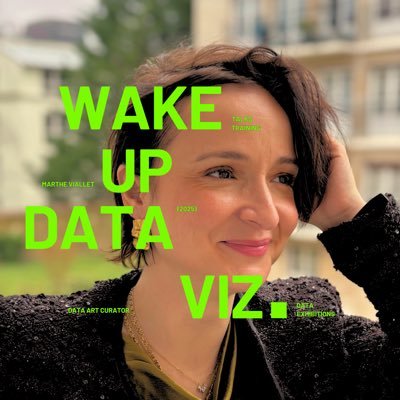
Marthe Viallet curates and designs exhibitions that connect data, art, and science to tell new stories about today’s world.
Specialized in data visualization, data art, and scientific mediation, she creates immersive experiences that make data visible, emotional, and meaningful.
At the crossroads of design, research, and digital culture, she collaborates with institutions, festivals, and local authorities to reveal the beauty and storytelling power of information.
Data art is a creative practice that transforms raw data into visually compelling artworks. By blending aesthetics with information, data artists use charts, patterns, and interactive visuals to reveal stories, emotions, and insights hidden within datasets.
Data art acts as a cursor between science and abstraction. Some works feel like scientific figures, with annotations and numbers that speak for themselves. Others drift into pure abstraction, only revealing their meaning with extra context.
While data art and generative art both involve digital creativity, they are not the same. Data art specifically uses real-world data as its source material, aiming to visualize information, patterns, or stories embedded in that data.
A data-art exhibition is more than a visual event: it’s a form of mediation, a collective experience, and a meeting point between art, science, and society.
By giving data a physical and poetic form, we make visible what usually remains abstract — climate, health, mobility, human emotion. These works awaken curiosity, wonder, and reflection, redefining our relationship to information.
For institutions, cultural festivals, and public organizations, data exhibitions are a powerful tool for awareness, innovation, and dialogue. They turn data into a sensitive language and open new conversations between experts and citizens. Because when data is well told, it can change the way we see the world.
Data To Art is a curated online gallery celebrating outstanding data art projects. Reach out if you’d like to submit your work for consideration.