Projects
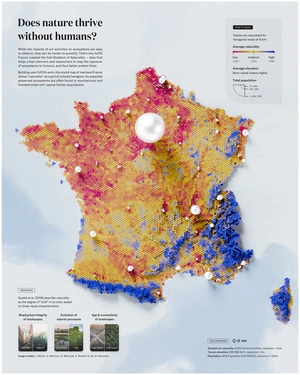
What if nature could tell us where it thrives — and where it’s fading away? This map reveals the hidden gradient of naturality across France, inviting you to explore the unseen impact of humans on ecosystems.
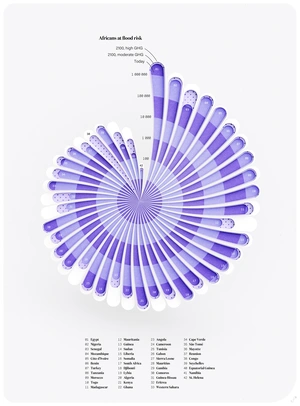
A data-driven visualization of coastal flood risk today and in 2100, under two greenhouse gas emission scenarios.
The Glove Rose is a unique data art project that transforms Olympic boxing analytics into a blooming digital rose, visually capturing the dynamics and outcomes of each match.
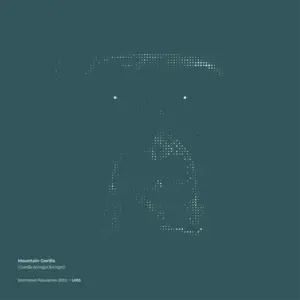
A generative design project that visualizes endangered species populations, where each dot represents a living animal and the image gradually disappears as numbers decline.
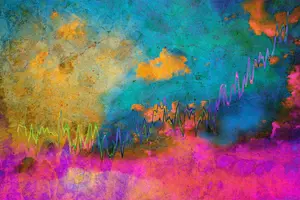
Environmental Graphiti transforms ecological data into striking visual narratives, merging art and sustainability to spark reflection on our natural world.
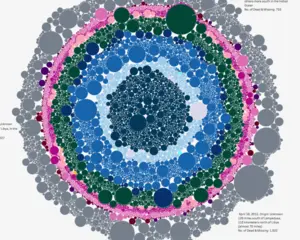
From 6th Oct 2023 - 8th August 2024: 33,696 Palestinian people were killed, each dot is someone who was killed.
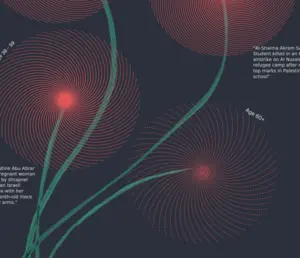
The Missing Migrants Project tracks people who died or went missing during migration toward international destinations. Each spiral represents a migration route, and each mark along it corresponds to an individual incident.
Fresquita Party is a data-driven visualization project that analyzes a 60-song Spotify playlist to reveal patterns of gender, diversity, and career representation among the artists behind the music.
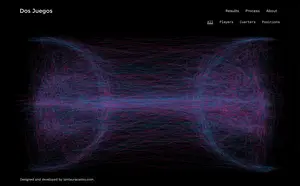
Dos Juegos is an experimental project that visualizes the trajectories of basketball players to explore how data analysis and visualization can enhance team performance and decision-making in sports.
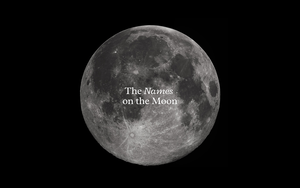
A visualization of the lunar surface features through their assigned names, categorizing them by people, places, proper nouns, and astronaut-named sites, and presenting the data in detailed lunar portraits inspired by NASA’s maps.
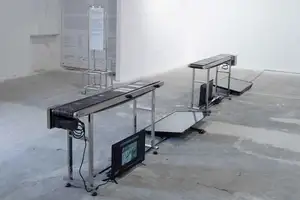
A data-driven installation that visualizes Romania’s and Europe’s waste management systems as interconnected conveyor belts.
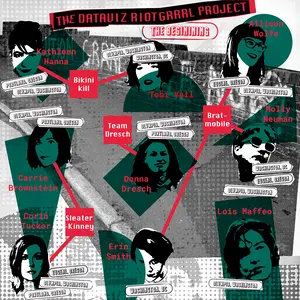
The dataviz Riot Grrrl project explores the feminist punk movement that emerged in the early 1990s in the Pacific Northwest of the United States.
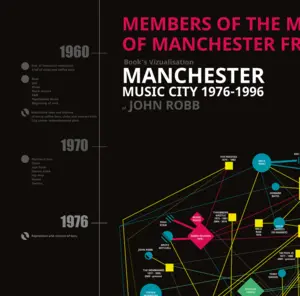
A data-driven network map revealing the web of relationships that shaped Manchester’s vibrant music scene from 1976 to 1996.
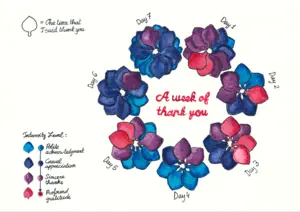
A fun and creative challenge for experimenting with data visualization techniques using personal data.
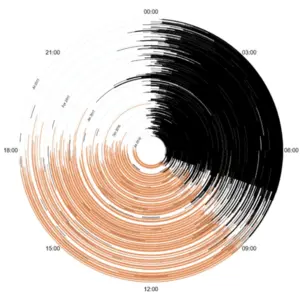
An exploration of the author own life data, where he visualized his sleep, work, and daily rhythms in dozens of creative, experimental ways to reveal hidden patterns.

A ceramic datasculpture made from Loire Valley clay, where each sphere represents a recorded flood of the Loire River in Orléans between 1800 and 2003.
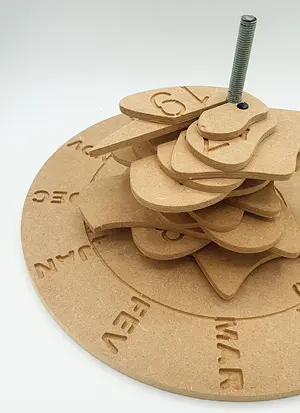
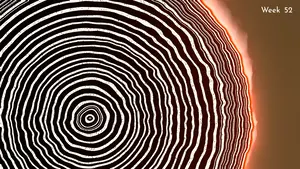
A wooden datasculpture representing monthly water height data of the Loire River in Orléans from 2000 to 2022, each disc symbolizing a year in the river’s changing flow.
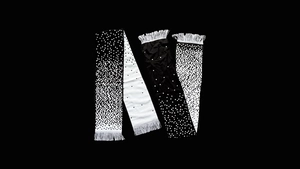
A scarf visualizing the thousands of migrant workers who died building stadiums for the Qatar World Cup, turning data into a wearable symbol that reminds us who we should truly support: human rights.

A redesigned advertising trophy with 28% of its form removed to reflect the gap separating women from equality in creative direction, turning an award into a critique and a call to action.
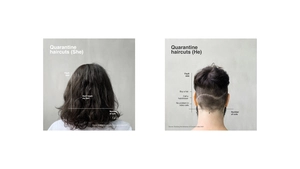
Everyday couple life during Covid-19 reimagined through tangible data visualizations, turning private routines into physical charts and objects that question the paradox of intimacy and data privacy.
An audiovisual artwork based on daily fire counts from the Swedish county of Skåne during the extreme summer of 2018, blending data sonification with audio-reactive visuals.
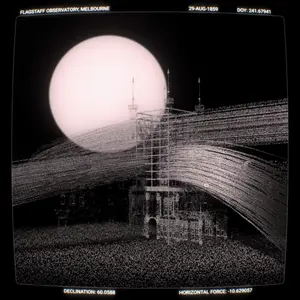
A collaboration telling the story of the largest solar storm in recorded history, transforming archival data from 1859 into audiovisual experiences designed to be played live and exhibited in gallery spaces.

A 10-hour sound art piece based on energy data collected overnight from volunteers in Malmö, Sweden — a meditative symphony of the unseen energy that hums in our homes every night.
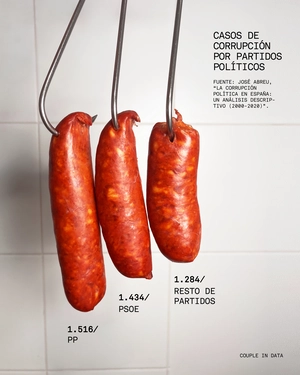
A data visualization project by Couple in Data exploring corruption through physical objects and tangible data.
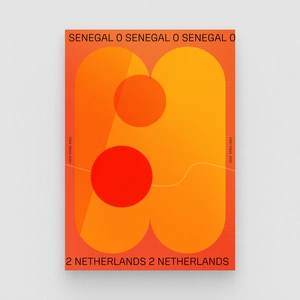
GenCup — a contraction of generative and World Cup — is a data-driven art project that turns football matches into textured visual compositions, one poster per game.