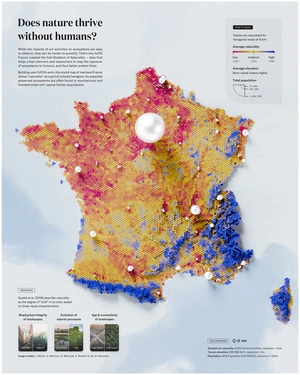
Naturality
What if nature could tell us where it thrives — and where it’s fading away? This map reveals the hidden gradient of naturality across France, inviting you to explore the unseen impact of humans on ecosystems.
Published on August 2, 2021


What if nature could tell us where it thrives — and where it’s fading away? This map reveals the hidden gradient of naturality across France, inviting you to explore the unseen impact of humans on ecosystems.
Published on August 2, 2021
How does nature survive alongside human civilization? It’s a question easier asked than answered. While we can see the visible scars of human activity — cities, roads, farms — the subtle ways ecosystems respond remain largely hidden.
This project unveils a new perspective: the Gradient of Naturality across mainland France.
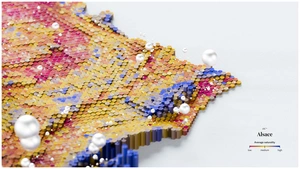
Developed in collaboration with IUCN France, this map uses a grid of colored hexagons to represent the "naturality": a measure of how much ecosystems are exposed to human presence. From densely populated urban centers to remote mountainous forests, each hexagon tells a story of balance, tension, and survival.
The data behind the map comes from a careful combination of sources: ecological statistics, population density, and terrain elevation. Using GIS software, these layers were combined into a grid of 8 km² hexagons, each analyzed to reflect average naturality and other environmental factors.

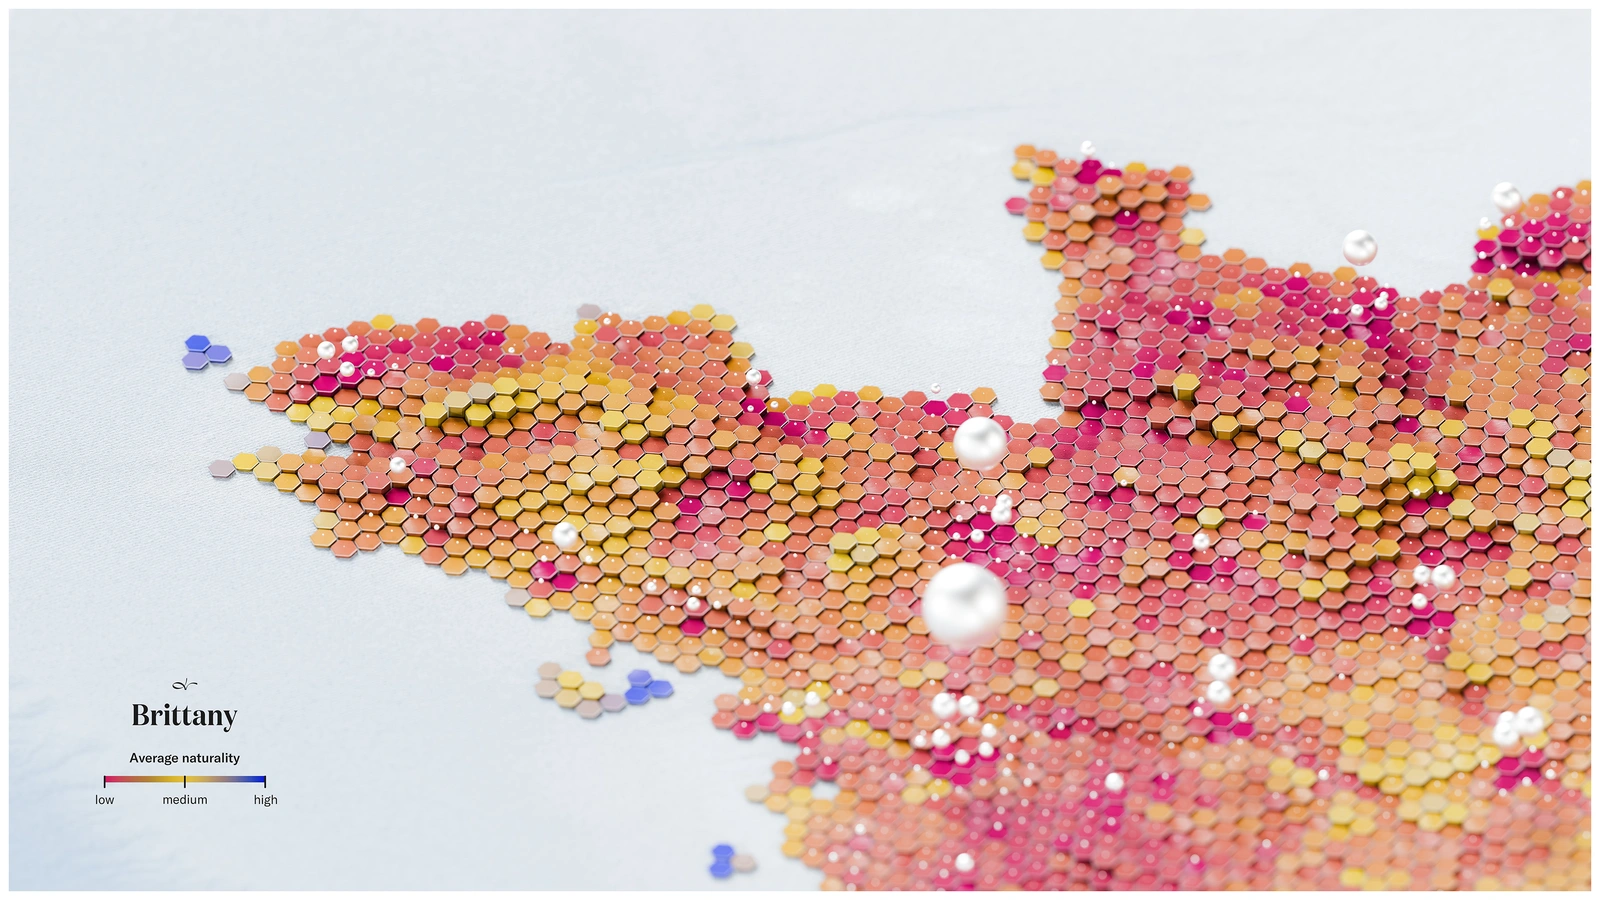


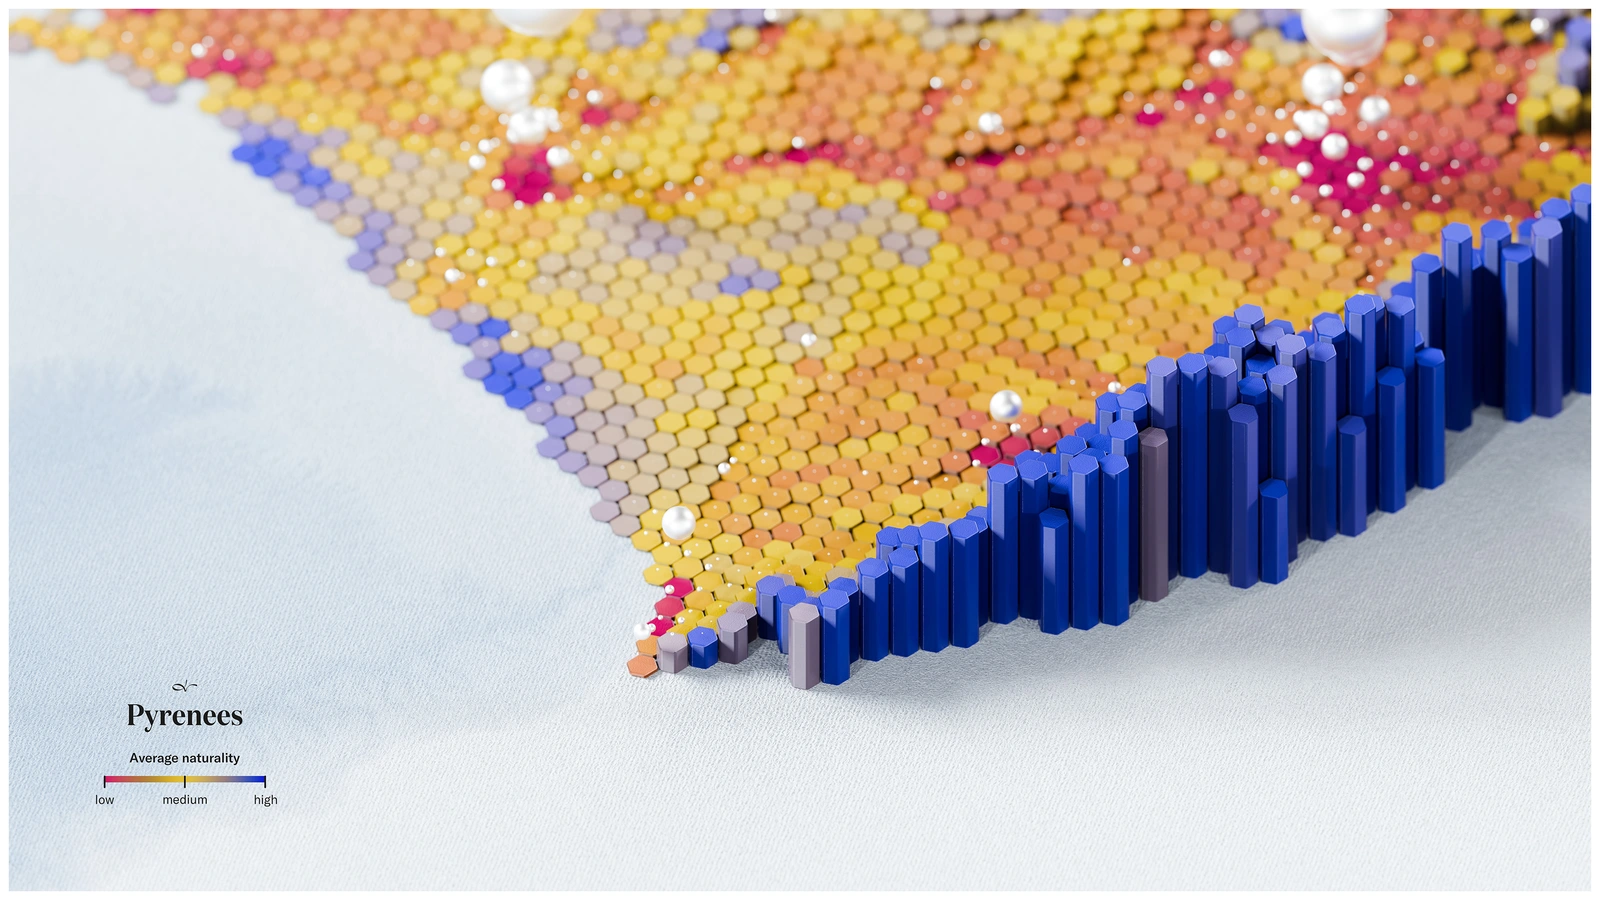
But the story doesn’t stop with numbers. Using Blender’s powerful 3D modeling tools, these data points were transformed into a vibrant visual narrative. Hexagons rise and fall in three-dimensional space, their heights and colors encoding elevation and naturality, while spheres represent population density. The result is a striking, dynamic cartographic visualization — a map that is not just seen but experienced.
Finally, a touch of artistry in Photoshop enhanced the visual appeal, balancing color and texture to create a compelling, shareable image that brings data to life.
This project isn’t just about maps; it’s about raising awareness. It challenges us to consider: what does it mean for nature to thrive in a human-dominated world? And how can we use data to protect these fragile ecosystems for future generations?
Explore the Gradient of Naturality and discover how data visualization can reveal hidden truths about our planet — one hexagon at a time.