Wet Feet
A data-driven visualization of coastal flood risk today and in 2100, under two greenhouse gas emission scenarios.
Published on August 6, 2025

A data-driven visualization of coastal flood risk today and in 2100, under two greenhouse gas emission scenarios.
Published on August 6, 2025
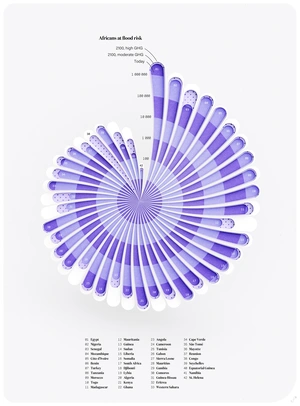
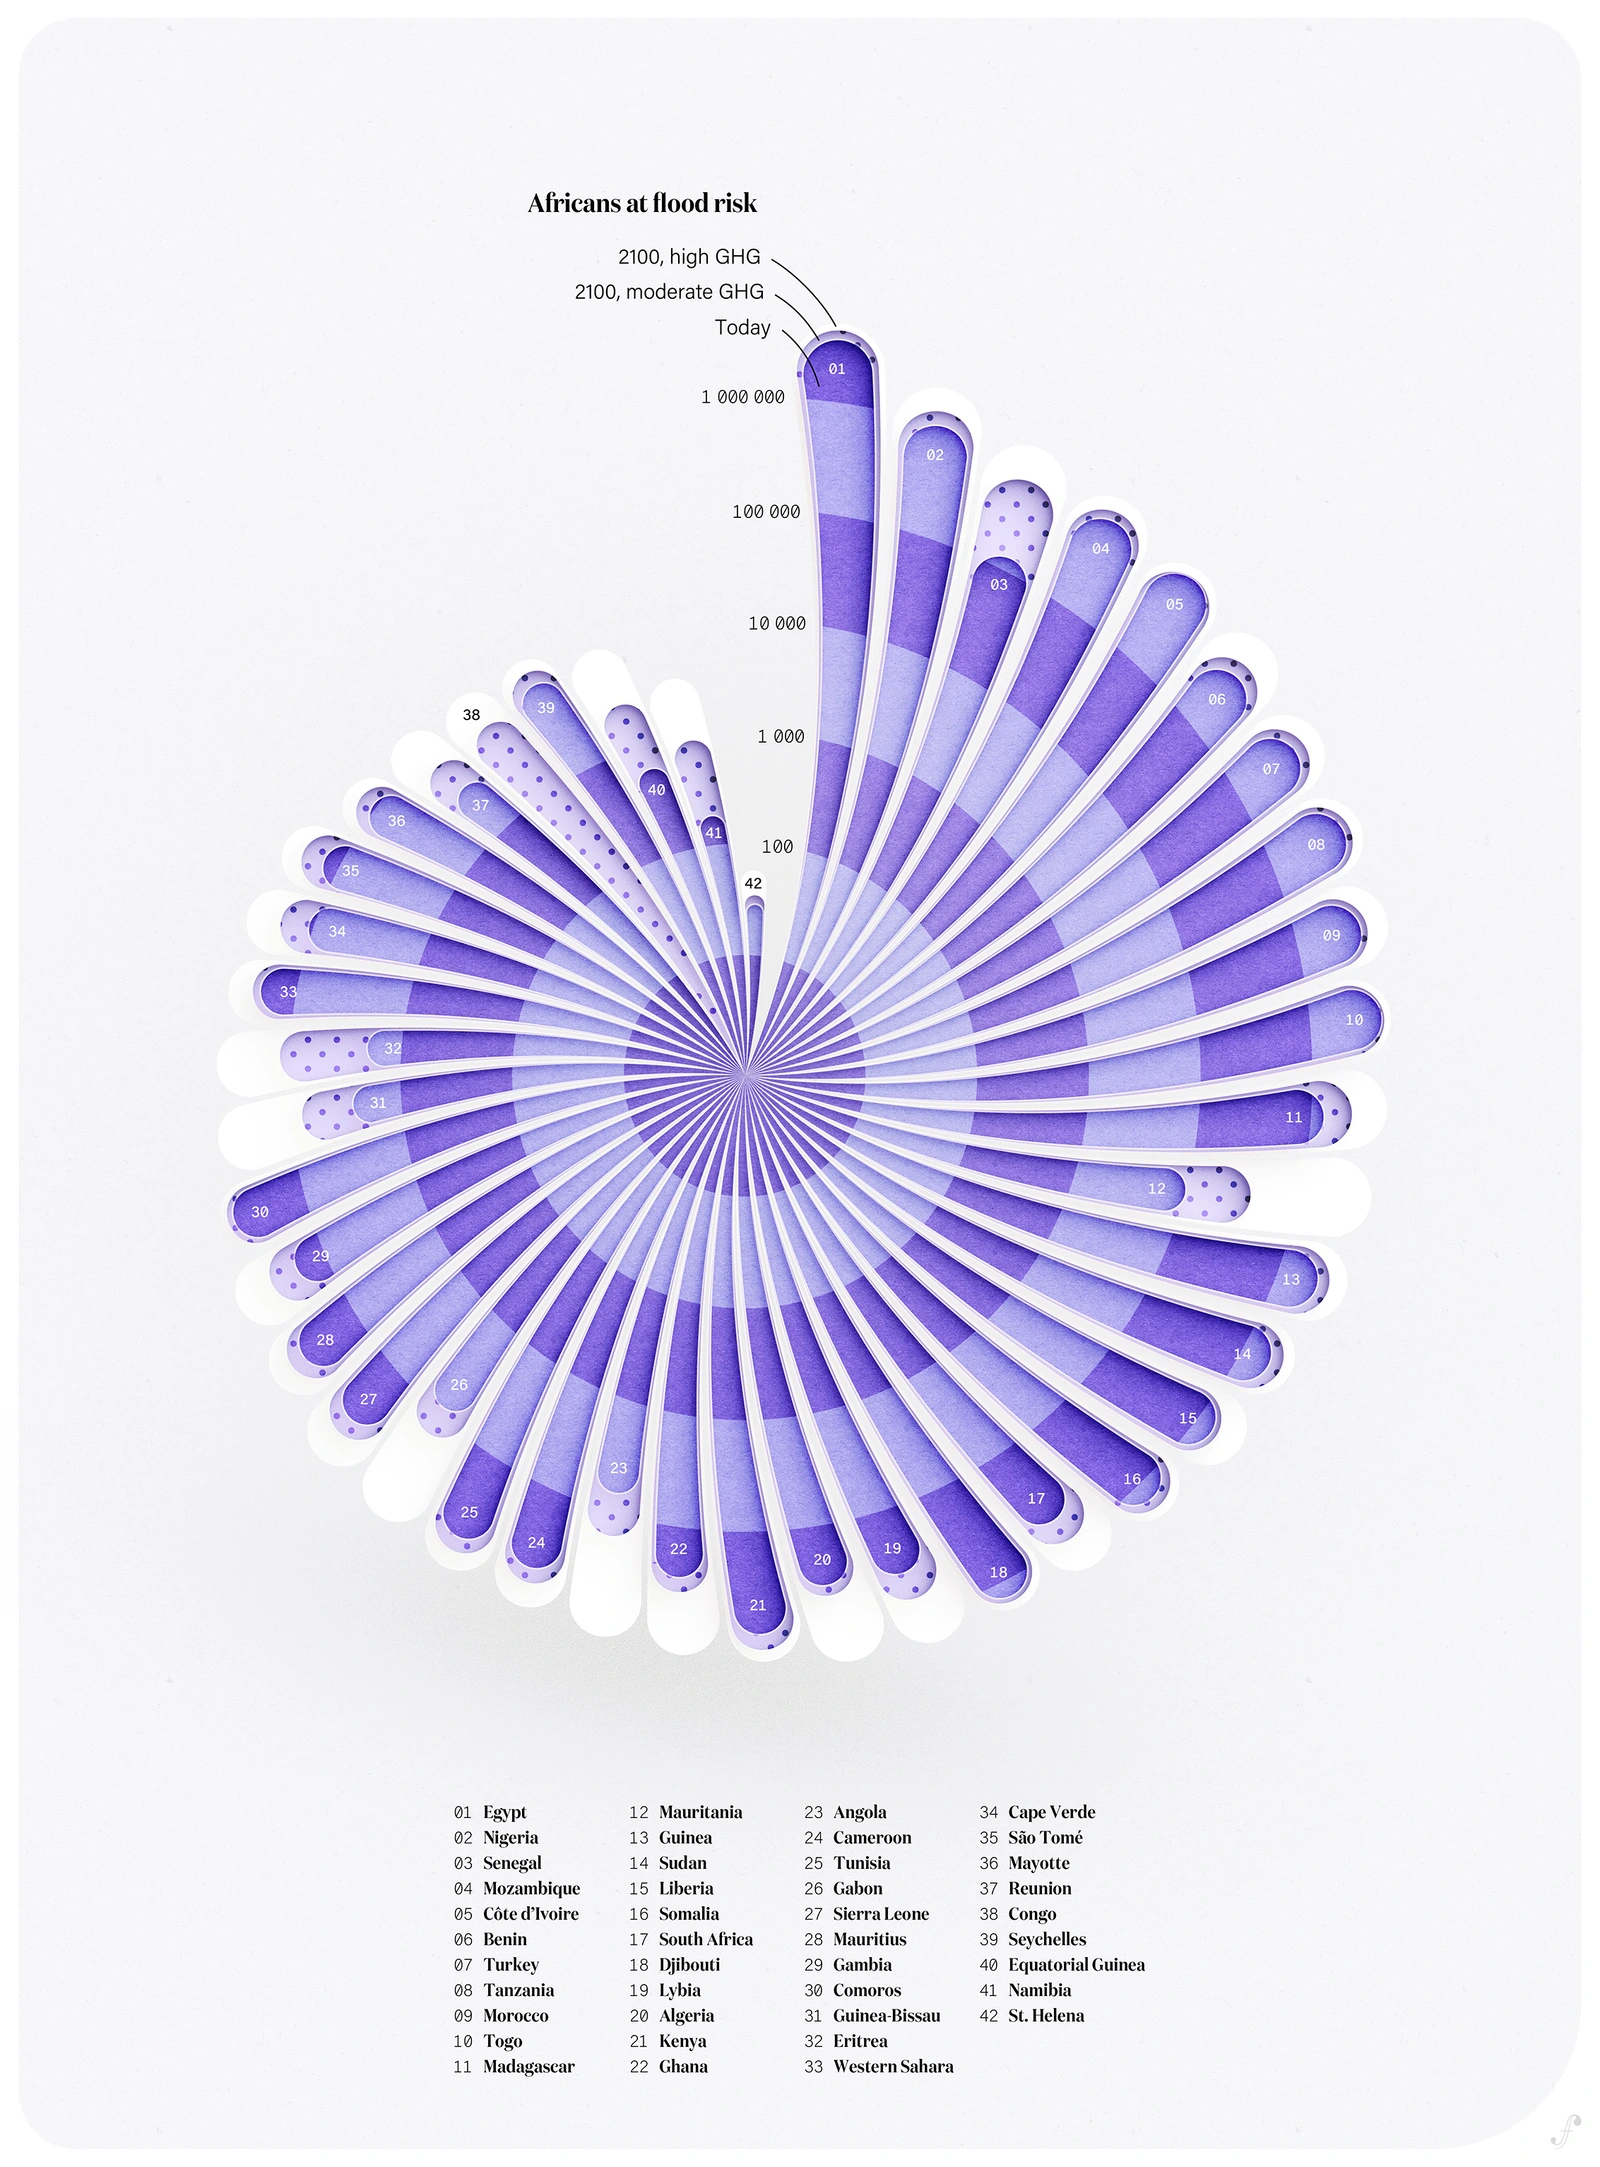
More greenhouse gases in the atmosphere mean higher global temperatures. As a consequence, frozen surfaces melt and bodies of water expand, threatening the lives of coastal inhabitants.
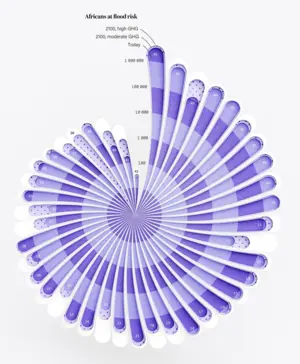
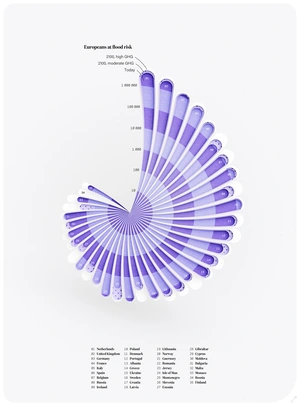
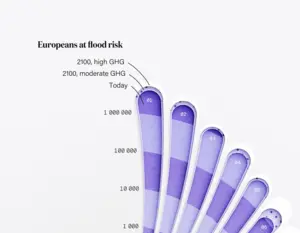
Based on a study from Kulp & Strauss (2019), this visualization shows the number of people at coastal flood risk per country today (plain color), in 2100 under a moderate greenhouse gas emissions scenario (dots), and in 2100 under a high emissions scenario with Antarctic ice melt (white).
The data, covering both present-day and future scenarios, highlights how climate change could drastically alter the lives of millions living near the sea. Countries with large coastal populations face the most severe risks, making the challenge both environmental and humanitarian.
The project began with raw datasets, which I processed using R to generate the initial graphs. These were then refined in Illustrator to ensure clarity, hierarchy, and visual appeal.
Wet feet, a project by Florent Lavergne
Each visual element is designed to be easily interpretable while retaining the scientific accuracy of the source material. The combination of data analysis, thoughtful layout, and clear storytelling makes this project a tool for raising awareness about the tangible impacts of climate change.